
Price Tracking Tools Explained: How Camelcamelcamel and Similar Sites Work

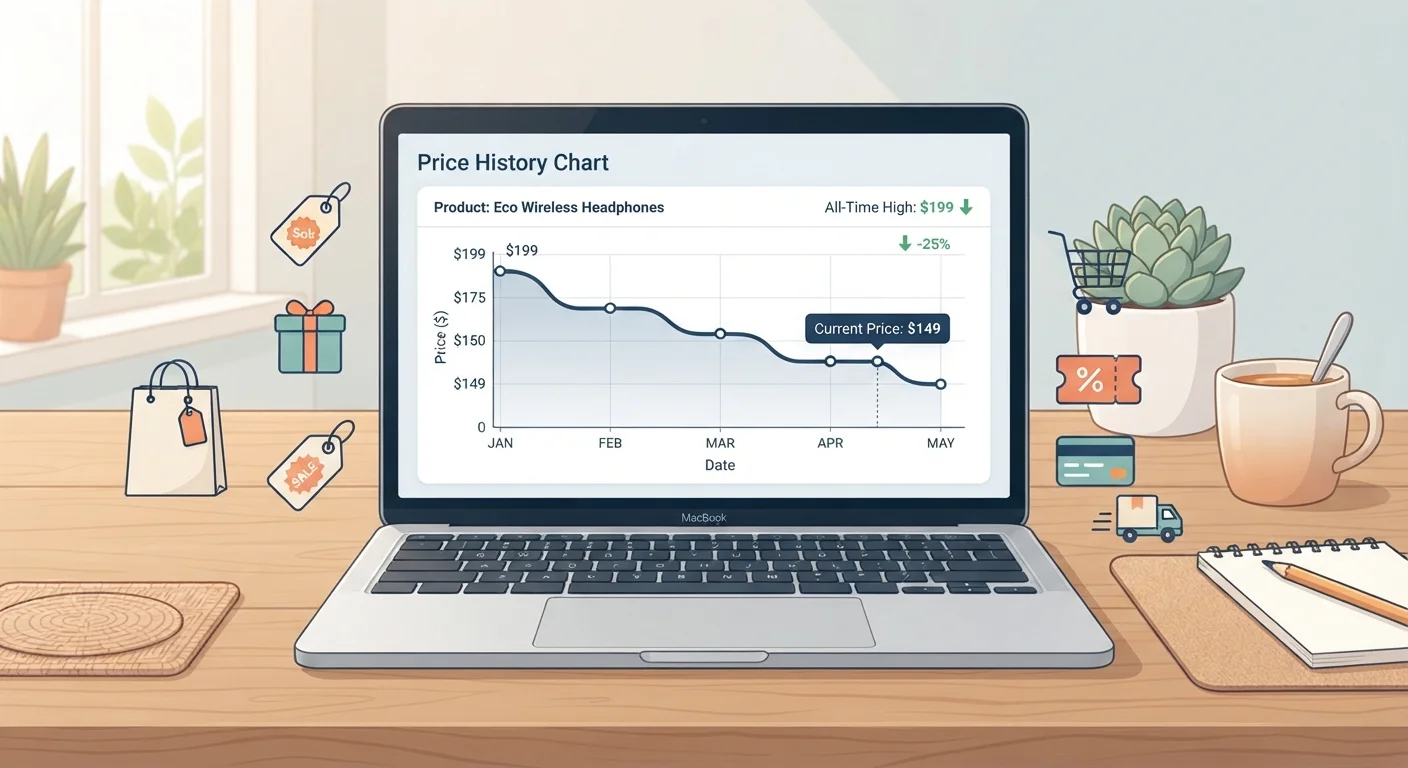
Photo: AnswersSquad.com | Explore Insightful Blogs editorial
Key Takeaways
- Price history charts reveal whether a 'sale' price is genuinely lower than usual or just normal pricing with a new label.
- Tools like CamelCamelCamel collect data by repeatedly checking product pages and recording the price at each visit.
- Price alerts let you set a target price and receive an email notification when the product reaches it.
- Price history does not guarantee future prices — it is a pattern guide, not a prediction engine.
- Combining price history data with retailer sale calendars gives you a stronger basis for timing a purchase.
How Price Trackers Collect and Store Data
Price tracking services work by sending automated requests to retailer product pages at regular intervals — a process known as web scraping. Each time a tracker visits a page, it reads the listed price and saves it alongside a timestamp. Over weeks and months, this builds a historical record that gets plotted as a chart.
The key variable is how often a tracker checks a given product. High-traffic or frequently purchased items are often checked multiple times per day. Less popular products might only be checked once every 24 hours, meaning the chart can miss brief price swings. This is worth keeping in mind when interpreting data: the chart reflects what the scraper saw, not necessarily every price the retailer displayed.
Most trackers also log prices separately by seller type. On Amazon, for instance, CamelCamelCamel typically records the Amazon-fulfilled price, the third-party new price, and the used price as distinct data series. This matters because a low headline price is sometimes driven by a third-party seller whose shipping costs or return policies differ from the retailer's own.
Scraping Reflects What Was Visible, Not Every Change
Reading a Price History Chart Without Getting Confused
A price history chart can look intimidating if you have never used one, but the logic is straightforward. The horizontal axis is time — usually spanning 30 days, 90 days, or the full history. The vertical axis is price. Each data point connects to form a line that shows you how the price moved.
What you are looking for is context. If the current price sits at the bottom of its historical range, that is a signal the item is at or near a low point. If the current price is in the middle or upper portion of the range, you may be able to wait. Some charts display the all-time low and 90-day low as labeled reference points, which simplifies this comparison considerably.
One pattern worth watching for is an artificial price spike. Some retailers temporarily raise a price before marking it down, so the discount looks larger. If you see the chart show an unusually high price for a short window immediately followed by a 'sale,' the discount may be less meaningful than it appears. This is sometimes called a reference price manipulation, and price history data is one of the clearest tools for spotting it.
~60%
Shoppers who misidentify inflated reference prices as real discounts
Research published by consumer behavior academics has found that a majority of shoppers accept artificial 'was/now' pricing at face value without checking historical price data.
1×/day
Typical minimum scrape frequency for product pages
Most price trackers check product listings at least once every 24 hours, though popular items may be checked more often, according to how these services describe their own methodology.
Setting Price Alerts: The Practical Core of These Tools
Viewing historical data is useful, but the real workflow upgrade comes from price alerts. Once you create a free account on a tracking site, you can specify a target price for any product. When the scraper detects that the price has dropped to or below that level, it sends you an email notification.
The key to using alerts well is setting a realistic target. Look at the chart and find the all-time low or the low from the past 90 days. Setting your alert just above the all-time low gives you a reasonable chance of being notified without waiting indefinitely for a price that may never return. If you need the item soon, set a slightly higher threshold and treat the alert as a floor rather than a guarantee.
For items on a wish list where timing is flexible, alerts effectively let the data do the monitoring for you. Instead of checking a product page manually every few days, you can set the alert and return only when conditions are favorable. This pairs naturally with understanding retailer discount cycles — something our guide to reading a retailer's sale calendar covers in depth.
Set Your Alert Slightly Above the All-Time Low
Limits to Understand Before You Rely on This Data
Price history is a pattern-recognition tool, not a crystal ball. A product that has dipped to a particular low three times in the past year may or may not do so again — demand, inventory, and retail strategy can all shift. Use the data to inform your decision, not to guarantee an outcome.
A few other limitations are worth flagging. First, these tools generally only work for products sold online; physical store pricing is outside their scope. Second, if a product is newly listed, the history is thin and less meaningful. Third, some product listings get consolidated or split over time, which can create gaps or inconsistencies in the data.
Price tracking also does not measure total value. A low price on a product that does not fit your actual needs is not a deal. Before acting on a price alert, it is worth pairing the data with metrics like cost-per-use — a concept our article on unit pricing and cost-per-use breaks down clearly. For a broader look at how price tracking fits into an overall savings approach, see our complete deal-finding playbook.
Frequently Asked Questions
The content provided on our blog site traverses numerous categories, offering readers valuable and practical information. Readers can use the editorial team’s research and data to gain more insights into their topics of interest. However, they are requested not to treat the articles as conclusive. The website team cannot be held responsible for differences in data or inaccuracies found across other platforms. Please also note that the site might also miss out on various schemes and offers available that the readers may find more beneficial than the ones we cover.